What's really going on in my Spotify playlist
With a bit of exploration, we learn and see a whole bunch of things about my Focus playlist without listening to a single second of music.
Introduction
In my last post, I talked about how I used Spotify’s API along with the Python package Spotipy to query some information about the songs I listened to, and the result was a Pandas dataframe containing my playlist for focusing (aptly named Focus) that I’m actually listening to as I write this post. I promised an analysis and asked for suggestions on what to analyze, but no one commented (you know who you are :), so I got some ideas for some fascinating things about this playlist that gave results I didn’t expect.
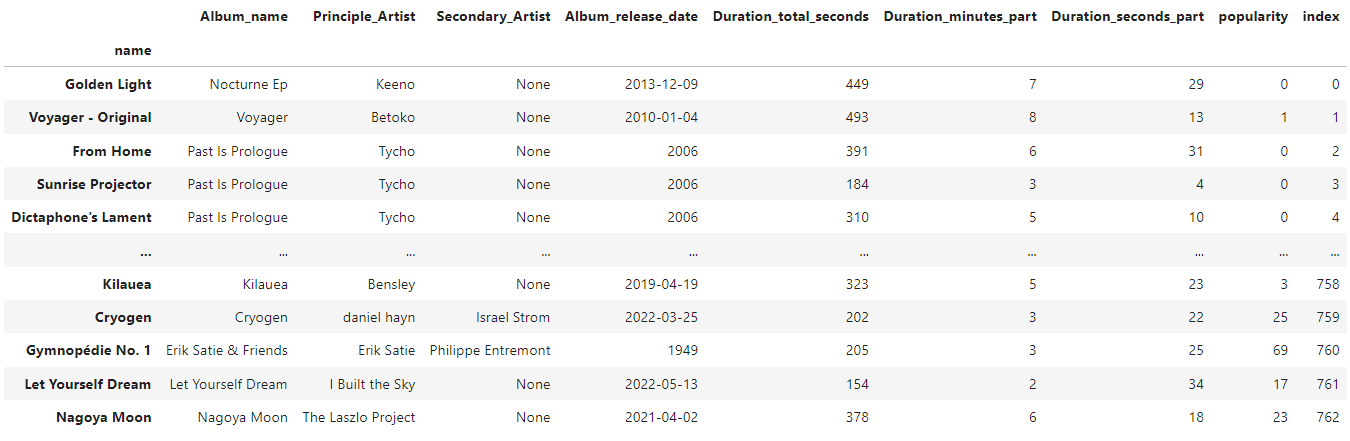
The playlist now has 763 songs (I added a new one last week) with 9 columns including principal and secondary artist, release date, song duration and popularity, and looks like this:
Album Release Year
One interesting thing about a playlist that one can’t usually see in Spotify very easily is the release date of each song. Are the songs in my Focus playlist generally old, or new? We can answer this question with a histogram, which will show years with more songs in the playlist as taller bars.
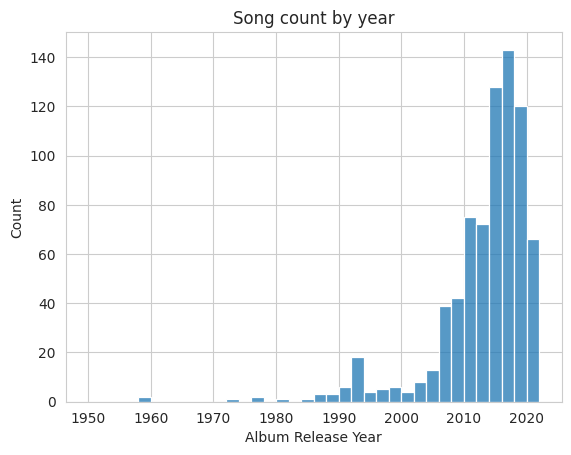
Turns out, they are quite a bit newer than I thought (especially with the quantity of classical music), but this illustrates an important point - just because a song was composed hundreds of years ago, production and recording quality is at its best right now, and that’s something I value when I am trying to focus.
Song length
When I study, I generally like to listen to longer songs - it helps me stay focused for longer and get into the vibe of the song. Some of my favorite songs for focusing are 10+ minutes long. So how long are the songs on this playlist? Again, I will use a histogram.
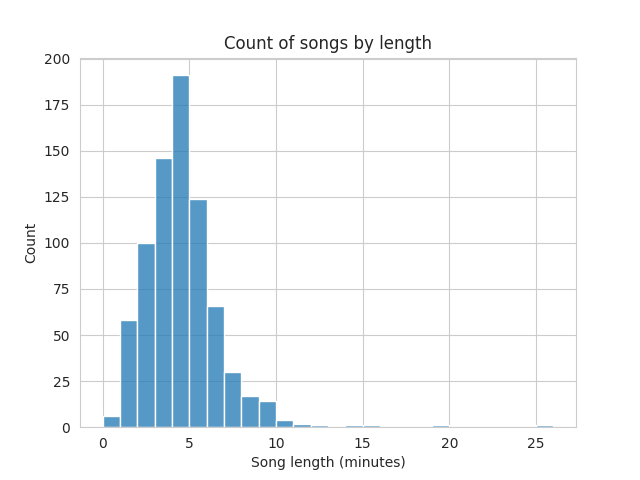
Each bar represents one minute. I find here that my playlists’ songs are typically 2-7 minutes long, and there are a decent amount of songs more than 5 minutes long, but I was surprised that there weren’t many longer than 10 minutes and there were quite a few shorter than 3 minutes.
Artists
The rest of my exploration dives into the world of those who make the music - the artists.
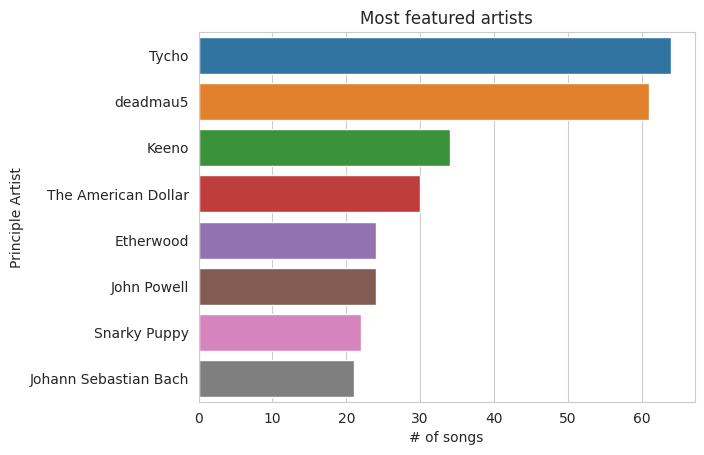
Which artists are the most featured?
Here are the top 8 artists in the playlist by number of songs in the playlist:
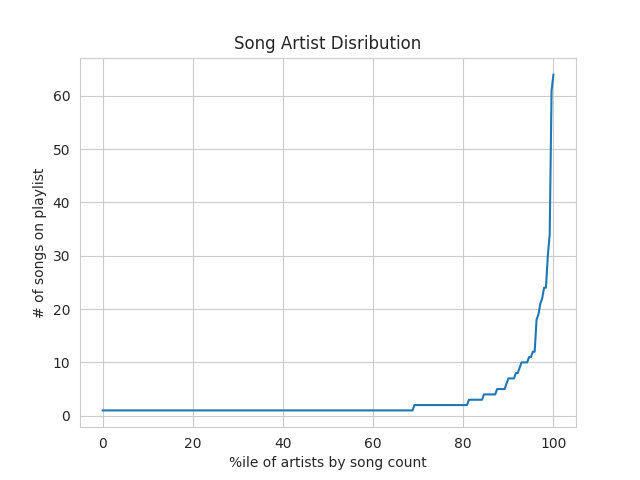
Taking a closer look, it seems like the majority of the songs in the playlist are from a select few artists, so I sorted the artists by number of songs, ranked them with percentiles, and plotted those percentiles against the number of songs each artist has in the playlist. I don’t know the name of this type of plot, but I could call it an ‘inequality distribution plot’ perhaps. Comment what you think it should be called.
Which artists are the most popular?
Specifically, which artists have the highest average popularity rating of the songs in the playlist? Disclaimer: this is likely to show mostly artists that only have one popular song in the playlist.
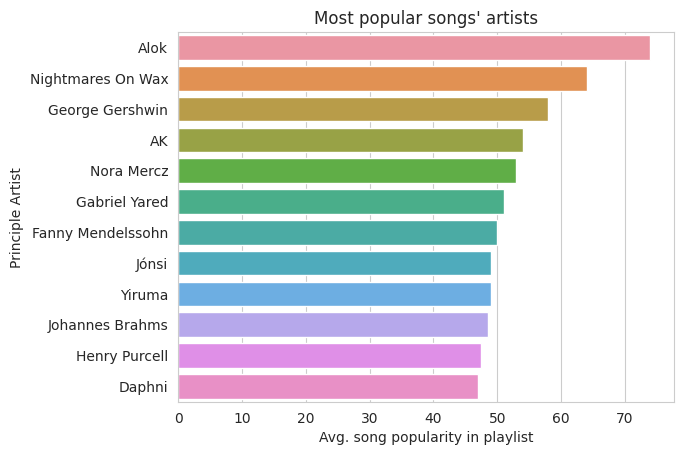
Do you recognize any of these artists?
Is there a relationship between Primary Artists and Secondary Artists?
My favorite idea came when I was looking at the two columns of artists and thinking “could it be that any of these Secondary Artists are also Primary Artists?” I made a couple of networks that connected all the artists to each other and found that the answer was generally no, but many Secondary Artists (typically performers of compositions by Primary Artists, in the case of classical music) performed music from various Primary Artists. Here’s the largest connected graph (see Wikipedia’s graph theory article for more info on what “graph” means here).
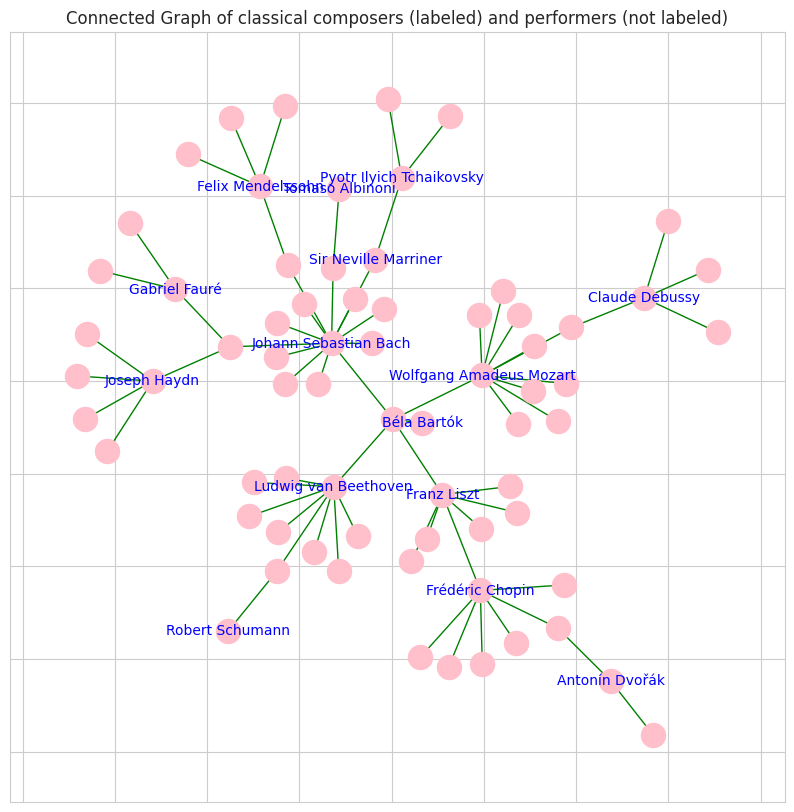
Here’s something interesting: The node connecting Haydn, Bach, and Fauré is none other than the world-famous cellist Yo-Yo Ma. He’s played from all three artists (naturally) and those songs are in my playlist.
Conclusion
This analysis was a ton of fun for me. I was able to look at essentially every piece of data from this dataframe and draw something interesting from it. We looked at release date, song duration, artist popularity, frequency, and even connectedness. And every different playlist will look different. If you’re interested in replicating this kind of analysis for your own playlist, feel free to follow my last blog post to get the dataset and use my code on my Spotify API Repository to make your own analysis. See what music you’re listening to!